Get2Green Data Dashboards
|
|
|
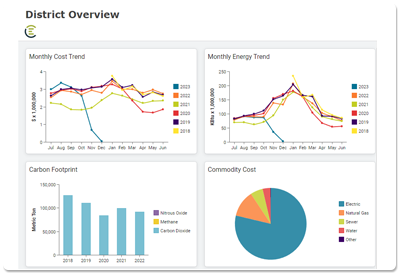
District OverviewProvides data for the district as a whole by year.
|
|
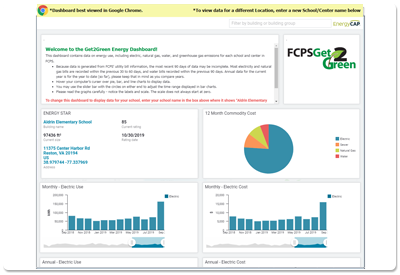
Energy DataUtility information for each FCPS location. It contains the most recent data within a 12 month cycle as well as the energy use & cost profiles for the last 5 years.
Launch Dashboard (Energy Data by Location) Launch Dashboard (Location Energy Details Map) |
|
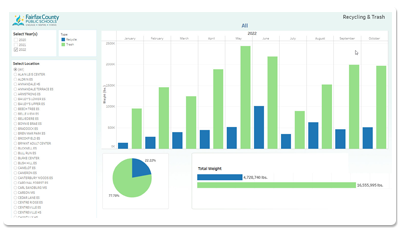
Recycling & TrashFind recycling and trash weight data for all of FCPS and each FCPS location. |
|
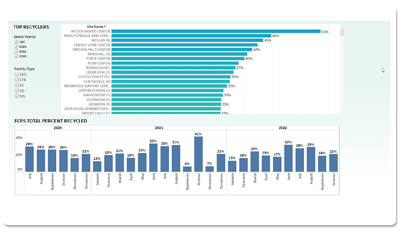
Top RecyclersSee where your location ranks among the "Top Recyclers" in FCPS!
|
|
If you require the data in the source Excel format, please email [email protected] and request a copy for download.


